asl_norm
Author: Maarten L. Buis
asl_norm computes bootstrap estimates of the Achieved Significance Levels (ASL) for a number of Gaussianity (normality) tests. This ASL can be interpreted as a more robust estimate of the p-value and/or as a simulation check of whether the chosen statistic is working well in your sample, i.e. whether the ASL corresponds with the asymptotic p-value.
This package can be installed by typing in Stata: ssc install asl_norm
Example
In a small sample most tests have at least some degree of trouble. In this case (74 observations) the Doornik-Hansen test leads to a p-value that is a bit too large.
. sysuse auto, clear (1978 Automobile Data)
. asl_norm trunk, dh reps(19999) nodots
Doornik-Hansen test statistic (chi2(2)): 1.91 asymptotic p-value: 0.3840 achieved significance level (ASL): 0.3577 95% Monte Carlo CI for ASL: [0.3511, 0.3643]
In larger samples the asymptotic p-values tend to be less problematic
. sysuse nlsw88, clear (NLSW, 1988 extract)
. gen lnwage = ln(wage)
. asl_norm lnwage if union < ., dh reps(19999) nodots
Doornik-Hansen test statistic (chi2(2)): 2.80 asymptotic p-value: 0.2465 achieved significance level (ASL): 0.2459 95% Monte Carlo CI for ASL: [0.2399, 0.2518]
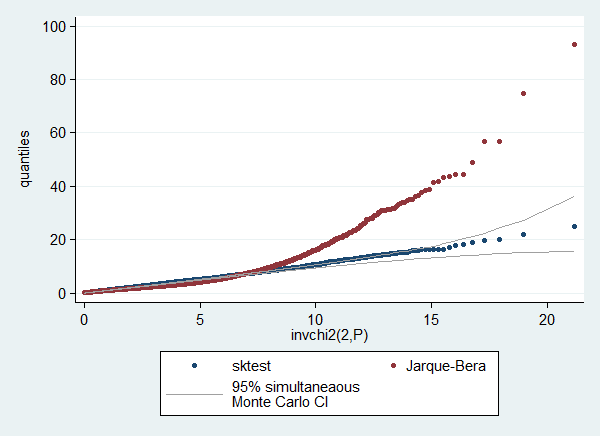
You can use the saving() option to perform a simulation of how well the tests perform for the number of observations in your dataset. This creates a dataset of test statistics on datasets where the null hypothesis is true, so the distribution of these statistics should correspond to the theoretical sampling distribution and the p-values should follow a continuous standard uniform distribution. This example requires the qenv, qplot, and simpplot packages.
. set seed 12345
. sysuse auto, clear (1978 Automobile Data)
. . tempfile res
. asl_norm trunk, jb sktest reps(19999) saving("`res'") nodots
Skewness/Kurtosis test statistic (chi2(2)): 4.19 asymptotic p-value: 0.1228 achieved significance level (ASL): 0.1298 95% Monte Carlo CI for ASL: [0.1252, 0.1345]
Jarque-Bera test statistic (chi2(2)): 2.02 asymptotic p-value: 0.3636 achieved significance level (ASL): 0.2548 95% Monte Carlo CI for ASL: [0.2488, 0.2608]
. use "`res'"
. . // check sampling distribution of test statistic . qenvchi2 sktest, gen(lb ub) df(2) overall reps(19999)
. qplot sktest jbtest lb ub, trscale(invchi2(2,@)) /// > ms(o o none ..) c(. . l l) lc(gs10 ..) /// > scheme(s2color) ylab(,angle(horizontal)) /// > legend(order( 1 "sktest" /// > 2 "Jarque-Bera" /// > 3 "95% simultaneaous" /// > "Monte Carlo CI"))
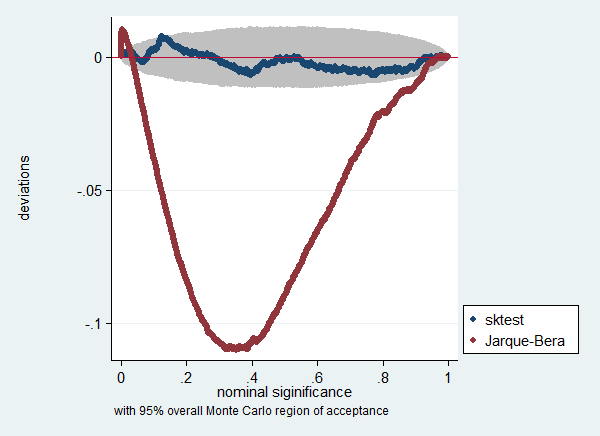
. . // test sampling distribution of p-values . gen p_sk = chi2tail(2,sktest)
. label var p_sk "sktest"
. gen p_jb = chi2tail(2,jbtest)
. label var p_jb "Jarque-Bera"
. simpplot p_sk p_jb, overall reps(19999) /// > scheme(s2color) ylab(,angle(horizontal))